Market Volatility Pattern Analyzer
Bull Market Characteristics
Average Duration: 988 days
Daily Volatility: Modest swings
Extreme Moves: Rare (< 10% of days)
Bear Market Characteristics
Average Duration: 289 days
Daily Volatility: Sharp spikes
Extreme Moves: Frequent (> 40% of days)
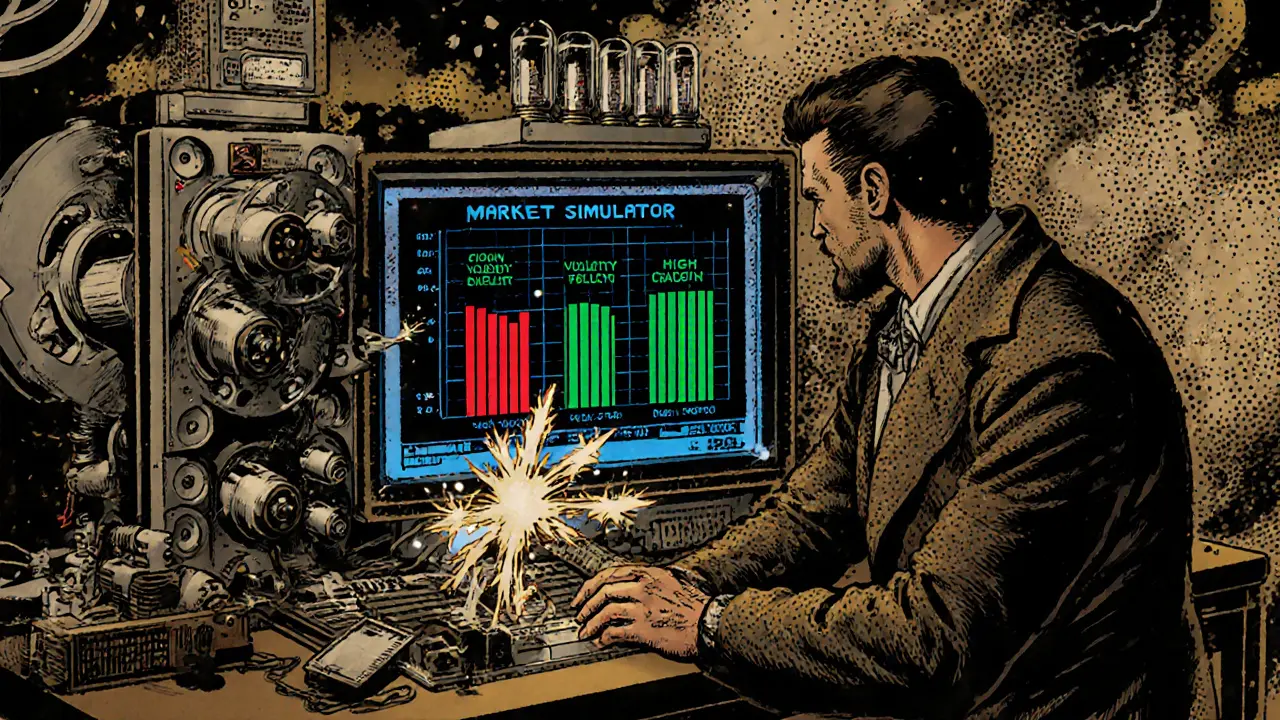
Market Phase Simulator
Simulation Results
Run a simulation to see how volatility patterns behave in different market conditions.
When markets swing, the rhythm feels chaotic, but the swings follow repeatable patterns. Recognizing how volatility behaves in rising (bull) versus falling (bear) phases lets investors spot risk, time decisions, and avoid costly surprises.
Key Takeaways
- Bull markets stretch over an average of 2.7 years with modest daily swings; bear markets compress into about 9‑10 months with sharper moves.
- Extreme single‑day moves (±2% or more) happen far more often in bear periods-42% of the S&P 500’s strongest days in the last 20 years occurred during down‑trends.
- Historical data shows a bear market roughly every 3.5years (post‑1945: every 5.1years), while bull phases dominate the timeline.
- Economic shocks, policy shifts, and even AI‑driven trading amplify volatility clusters, creating brief but intense spikes.
- Managing exposure requires matching portfolio tactics to the distinct volatility signature of the current market phase.
Defining Bull and Bear Markets
Bull market is a phase where a broad index climbs at least 20% from a recent low and stays elevated for a minimum of two months. By contrast, a bear market drops 20% or more from a prior peak and remains depressed for an extended stretch.
These thresholds, set in the 1930s, give analysts a clear break‑point to switch from “correction” (10‑19.9% decline) to full‑blown bear status. The S&P 500, tracked since 1928, has logged 27 bears and 28 bulls, offering a rich sample for pattern analysis.
Measuring Volatility Across Cycles
Volatility patterns capture the speed and magnitude of price changes. The most common gauge is the daily price range; a swing of ±2% or more marks a high‑volatility day. In the 2008 crisis, 72 of 253 trading days breached that level, while the calm year of 2017 saw none.
Two complementary lenses matter:
- Duration - How long the market stays in a given phase. Bears average 289 days; bulls stretch to 988 days.
- Amplitude - The size of daily moves. Bears pack larger spikes into a shorter window, whereas bulls spread smaller fluctuations over years.
These dynamics create a “volatility clustering” effect: turbulent periods concentrate both sharp gains and losses, while tranquil stretches produce steady, modest returns.
Historical Data & Patterns
From 1928 to today, the S&P 500’s bear‑phase frequency shifted dramatically. Pre‑World‑WarII, a bear surfaced roughly every 1.5years; post‑1945 the gap widened to about 5.1years. This slowdown aligns with stronger regulatory frameworks and more proactive monetary policy.
Performance contrasts are stark. Bull cycles generate an average 112% gain, while bear cycles average a 35% loss. However, the most volatile single days often belong to the bear side. In the 2022 down‑year, half of the 46 most volatile days were positive moves, underscoring that sharp rebounds can pop up amid overall decline.
Economic backdrop matters too. Years with >10 high‑volatility days tend to hover around zero percent S&P 500 return and sluggish GDP growth, whereas periods with <10 such days average nearly 20% equity returns and 3% GDP expansion.
Side‑by‑Side Comparison
| Attribute | Bull Market | Bear Market |
|---|---|---|
| Average Duration | ≈ 988 days (2.7years) | ≈ 289 days (9.6months) |
| Typical Daily Swing | ±0.5% to ±1% | ±1% to ±2% (or more) |
| Frequency of ±2%+ Days | Rare (0‑2 per year) | Common (10‑30 per year) |
| Average Cumulative Return | +112% | -35% |
| Impact of Economic Shocks | Gradual price adjustment | Sharp, clustered spikes |
Drivers Behind the Volatility Split
Multiple forces shape each phase’s volatility signature.
- Economic cycles - Recessions squeeze earnings and stoke fear, feeding bear volatility.
- Monetary policy - Aggressive rate hikes can trigger rapid sell‑offs, while dovish stances smooth bull moves.
- Geopolitical events - Wars, pandemics, and trade disputes create sudden uncertainty, often timed with bear spikes.
- Market valuation levels - Over‑valuation sets the stage for larger corrections that may tip into bear territory.
- Technology & AI trading - Algorithmic strategies react in milliseconds, amplifying short‑term swings, especially during stressed periods.
Research from Hartford Funds emphasizes that a 35% decline is a statistical baseline for bear markets, not an outlier. BlackRock links frequent 2%+ daily moves to broader economic dislocation, noting that such volatility often precedes policy pivots.
Insights from Charles Schwab remind us that bear triggers are heterogeneous-weakening GDP, liquidity squeezes, or a sudden sentiment shift can each spark a downturn, sometimes without reaching the 20% bear threshold.
Practical Implications for Investors
Knowing the volatility pattern helps tailor risk management tactics.
- Adjust position size - Shrink exposure when entering a bear environment to reduce the impact of big swings.
- Use volatility‑based stops - Wider stops in bull markets, tighter stops in bears, aligning with expected daily amplitude.
- Diversify across asset classes - Bear volatility often spills into bonds; monitoring Treasury yields (e.g., a 33‑bp jump from 4.01% to 4.34% in a recent episode) can signal cross‑market turbulence.
- Consider volatility‑targeted funds - Products that scale investment based on the VIX or realized volatility can smooth returns.
- Stay alert to policy cues - Central bank announcements now produce 9.5% single‑day equity swings, followed by rapid reversals, demanding swift re‑balancing.
In a bull stretch, a modest volatility pattern outlook encourages a higher equity allocation, while a bear phase urges defensive tilts and active monitoring.
Emerging Trends Shaping Future Patterns
The classic 20% threshold still defines market phases, but the mechanics of volatility are evolving.
- AI‑driven execution - Machine‑learning models can anticipate micro‑price moves, compressing reaction times and creating flash‑crash‑like spikes.
- Real‑time policy dissemination - Social‑media‑fueled news cycles mean markets digest central‑bank moves within seconds, intensifying short‑term swings.
- Global coordination - Coordinated rate actions across major economies may dampen isolated bear spikes but also generate synchronized global volatility.
Researchers at Capital Group observed that tariff announcements can thrust an index into temporary bear territory, only to rebound 9.5% after the pause-illustrating how policy shockwaves can produce rapid, reversible volatility.
Keeping an eye on these developments will help investors adapt the traditional volatility framework to a faster, more interconnected market landscape.
Frequently Asked Questions
How is a bear market officially defined?
A bear market occurs when a broad market index falls 20% or more from a recent high and stays below that level for at least two months.
Why do bear markets show higher daily volatility?
Fear, reduced liquidity, and rapid policy reactions compress the market timeline, causing larger price swings in a shorter period.
Can volatility patterns predict the start of a bear market?
Increased frequency of ±2%+ days often signals rising uncertainty, but a definitive switch usually awaits the 20% price drop threshold.
How do Treasury yields react to equity market volatility?
During equity turbulence, investors often shift to bonds, pushing yields up or down sharply; a recent example saw 10‑year yields move 33 basis points in a single week.
What role do AI trading systems play in modern volatility?
AI algorithms trade at millisecond speeds, amplifying reactions to news and policy cues, which can create flash spikes especially in already stressed bear phases.


There are 21 Comments
Alie Thompson
Volatility is the relentless pulse of the market, and anyone who pretends otherwise is willfully blind to its moral implications.
Investors who chase glittering returns during bull runs without acknowledging the lurking bear risks betray a fundamental lack of prudence.
The data clearly shows that bear markets compress into fierce, short bursts, demanding humility from even the most seasoned traders.
When you ignore the statistical reality that extreme moves dominate down‑trends, you succumb to hubris.
Our collective responsibility is to respect the cyclical nature of markets, not to worship perpetual growth.
The average bull market may stretch nearly three years, yet it is the quiet periods that lull us into complacency.
Every spike of ±2% in a bear is a stark reminder that chaos respects no portfolio size.
One must therefore align risk tolerance with these immutable patterns, lest they become the next cautionary tale.
History does not lie; regulations and policy frameworks have attempted to temper the frenzy, but the human element remains the wild card.
To act otherwise is to gamble on moral absolutes that simply do not exist in financial ecosystems.
Hence, any strategy that dismisses the frequency of extreme bear days is inherently reckless.
We must inculcate discipline, not just chase fleeting momentum.
The market's rhythm is a teacher, not a toy.
We owe it to future generations of investors to internalize these lessons.
Only through sober acknowledgment can we hope to navigate the inevitable swings with integrity.
Samuel Wilson
The analysis provides a solid framework for understanding how volatility behaves across market phases.
From a coaching perspective, recognizing the average durations of bull and bear cycles equips traders with a timeline for strategic planning.
Applying a disciplined allocation that respects the modest daily swings in a bull market can preserve capital during prolonged uptrends.
Conversely, tightening risk controls during the high‑volatility spikes of a bear market can mitigate drawdowns.
It is essential to monitor the proportion of extreme‑move days, as their prevalence directly influences position sizing.
Regularly revisiting the volatility clustering effect will help maintain a balanced risk‑reward profile.
Overall, integrating these patterns into a systematic approach should enhance decision‑making consistency.
Rae Harris
Yo, the whole bull‑bear volatility thing is just a fancy meme for market noise, bro.
Danny Locher
Got to say, the breakdown of average durations really puts things into perspective.
It’s wild how a bull can cruise for almost a thousand days while a bear screams out its story in less than a year.
That’s why I always keep a small cash buffer – you never know when the market’s about to flip.
Seeing the extreme‑move percentages also helps me decide when to tighten stops.
Bottom line: understand the rhythm, then you can dance to it, not the other way around.
Emily Pelton
Listen up, this post isn’t just a data dump; it’s a wake‑up call for anyone still treating market volatility as a side note!
First, the statistics brutally expose how bear markets slam the door on your portfolio with far‑more frequent extreme moves.
Second, the notion that bull markets are “gentle” is a dangerous illusion that lulls complacent traders into overexposure.
Third, if you ignore the clustering of high‑volatility days, you’re basically signing up for a financial free‑fall.
Fourth, the historical shift toward longer bull phases does NOT guarantee safety – it merely stretches the waiting period for the next shock.
Fifth, every investor must recalibrate risk thresholds according to these clear patterns, or risk being battered when the next bear hits.
Sixth, this is not just theory; it’s backed by decades of S&P data that you can’t dispute.
Seventh, the takeaway is simple: respect volatility, respect the cycles, and stop acting like you own the market!
Finally, the only sustainable path forward is disciplined position sizing aligned with these proven volatility signatures.
sandi khardani
Wow, another attempt to glorify the so‑called “patterns” in market volatility – what a joke!
People love to pretend they have a crystal ball when all they have is a spreadsheet of historical averages that are as reliable as a weather forecast from the 1800s.
First, the whole premise that bull markets “stretch” for almost three years ignores the countless micro‑crashes hidden within those periods.
Second, the claim that bear markets are simply “sharp spikes” is reductive, as if every decline is a monolithic event, when in reality they are triggered by a myriad of hidden macro‑forces no one can predict.
Third, you can’t trust the S&P 500 to be the universal yardstick; it’s merely a curated index deliberately filtered to look smooth.
Fourth, periodizing volatility into neat buckets is a comforting illusion for those unwilling to grapple with true market chaos.
Fifth, the idea that regulators and policy frameworks have “tamed” volatility is absurd – they just shift risk, they don’t eliminate it.
Sixth, the whole emphasis on “extreme‑move days” is a distraction from the more insidious risk of liquidity crunches, which occur silently until they explode.
Seventh, the data points you cherry‑pick are taken out of context, ignoring the fact that each bear cycle has its own unique catalyst that invalidates sweeping generalizations.
Eighth, relying on historical averages to shape future risk is a perilous gamble – the past is a poor predictor of the future, especially when the underlying economic landscape is changing at breakneck speed.
Ninth, you “encourage” readers to align portfolios with these patterns, yet you provide no actionable framework beyond vague advice, which is essentially a hollow mantra.
Tenth, the whole exercise feels like a self‑congratulatory exercise for data nerds who think number crunching absolves them of real insight.
Eleventh, anyone who takes this as a gospel will soon learn the hard way that markets are driven by human psychology, not just numbers.
Finally, stop feeding the illusion that you can outsmart volatility with tidy charts – the market will always have the last laugh.
Donald Barrett
Enough with the boring charts – markets crush you if you don’t stay alert.
Cindy Hernandez
While the moral undertones are clear, it’s crucial to recognize the cultural dimension of market behavior.
Different investor communities react to volatility with varying risk appetites, reflecting regional economic histories.
For instance, Asian markets often display a more conservative stance during bear phases, whereas North American traders may double down on speculative bets.
Understanding these nuances can further refine the broader volatility framework presented.
Karl Livingston
The systematic breakdown you’ve provided aligns well with disciplined trading principles.
In practice, I’ve seen that integrating a volatility‑adjusted position size can reduce drawdowns by a noticeable margin.
Moreover, the emphasis on extreme‑move days as a trigger for tighter stops is a pragmatic rule that many overlook.
Balancing exposure across the identified bull‑bear cycles helps maintain a steady equity curve.
Overall, the data‑driven approach reinforces the importance of adaptability in portfolio construction.
Kyle Hidding
Let me just say that any “systematic breakdown” is as flimsy as a spreadsheet in a hurricane.
Volatility clusters are not some tidy metric you can plug into a trivial model.
They cascade, they mutate, and the so‑called “adjusted position size” you brag about is merely a Band‑Aid on a broken arm.
Don’t waste your time with these oversimplified rules; the market will eat them for breakfast.
Fiona Chow
Nice try, but that contrarian vibe just sounds like a bored teenager trying to be edgy.
If you’re not adding anything new, you’re just echoing the same old noise.
Christina Norberto
It is evident to the discerning observer that the mainstream narrative surrounding market volatility is a carefully curated façade designed to lull the masses into a false sense of security.
Consider the hidden machinations of the Federal Reserve, whose covert policy adjustments are often disguised as benign statements, yet they precipitate seismic shifts in market dynamics that are deliberately obfuscated from the public.
Furthermore, the alleged “average duration” of bull and bear cycles fails to account for the clandestine interventions executed by shadowy financial oligarchs who manipulate liquidity pipelines to engineer desired outcomes.
These actors possess the capability to amplify volatility clusters at will, effectively weaponizing market turbulence to serve their geopolitical agendas.
The prevailing data sets are filtered through algorithms crafted by these same entities, ensuring that only sanitized metrics reach the average investor, thereby perpetuating an illusion of transparency.
In addition, the recurring pattern of extreme‑move days coinciding with geopolitical crises is not a coincidence but a manifestation of coordinated market stress tests designed to probe systemic resilience.
Consequently, any purported strategy that relies on historical averages without factoring in this covert layer of manipulation is fundamentally flawed.
It is incumbent upon vigilant market participants to dissect beyond the surface statistics and interrogate the underlying power structures that dictate volatility.
Only through this heightened awareness can one hope to navigate the labyrinthine complexities that truly drive market behavior.
Andrea Tan
I appreciate the calm perspective on risk management.
Keeping a flexible cash reserve is a sensible habit in both bull and bear markets.
It helps stay resilient when volatility spikes unexpectedly.
Emily Pelton
To add onto the earlier point, investors must also consider sector‑specific volatility, not just broad market indices.
Technology, for example, can exhibit amplified swings even during a stable bull phase.
Adjusting exposure based on sector dynamics further refines risk control.
In short, granularity matters alongside the macro view.
Gaurav Gautam
Great breakdown! This really sparks motivation to incorporate volatility‑aware tactics into my daily trading routine.
Seeing clear numbers behind the cycles makes the abstract concept tangible.
I’ll start tracking extreme‑move days as a personal KPI.
Thanks for the actionable insight – it’s exactly what the community needs to level up.
Robert Eliason
Yo boi, this is like u think it s all bright an d shiny but the marks in the board look like crap lol.
i dont kno why u say bull 9yerrs aint prob comming with out panic, but i think it s all a scam.
the stat figures can be tweekd a lil, you get wha i meen?
maybe the market is rigdegt mid? never know.
but ... i wld proby try w/ less cash next week???
anyway thx for the aticle i saw the graph ot the thing.
Cody Harrington
Appreciate the perspective.
Let’s keep the discussion focused on data‑driven insights.
Chris Hayes
The distinction between bull‑era stability and bear‑era turbulence is a cornerstone of sound portfolio theory.
Recognizing that volatility clustering intensifies during downturns allows investors to pre‑emptively adjust leverage.
Moreover, the historical frequency of bear phases suggests a cyclical risk premium that can be priced into asset allocations.
By aligning exposure with these empirically derived patterns, one can potentially smooth returns across market regimes.
This approach also mitigates the psychological pitfalls of chasing performance during euphoric bull runs.
victor white
While the statistical elegance is commendable, one must acknowledge the shadowy networks that influence market sentiment behind the scenes.
Elite financiers, through covert alliances, may engineer volatility spikes to profit from short‑selling strategies, thereby distorting the natural cycle.
This hidden orchestration casts doubt on the purity of any observed pattern.
mark gray
Good points, thanks for sharing.
Ayaz Mudarris
The philosophical underpinnings of market volatility reveal a deeper truth: financial systems are a reflection of collective human behavior, an emergent property of countless individual decisions.
When we study the regularity of bull and bear cycles, we are, in effect, observing the rhythm of optimism and fear that pervades societies.
From a historical perspective, the lengthening of bull phases post‑World War II aligns with broader socio‑economic stability, yet this stability is fragile, susceptible to abrupt perturbations.
Thus, the awareness of volatility clustering is not merely a trading tool but a lens through which we can examine the resilience of our economic institutions.
In practice, integrating this awareness into risk management fosters not only financial prudence but also a more nuanced appreciation of market dynamics as a living system.
Write a comment
Your email address will not be published. Required fields are marked *