
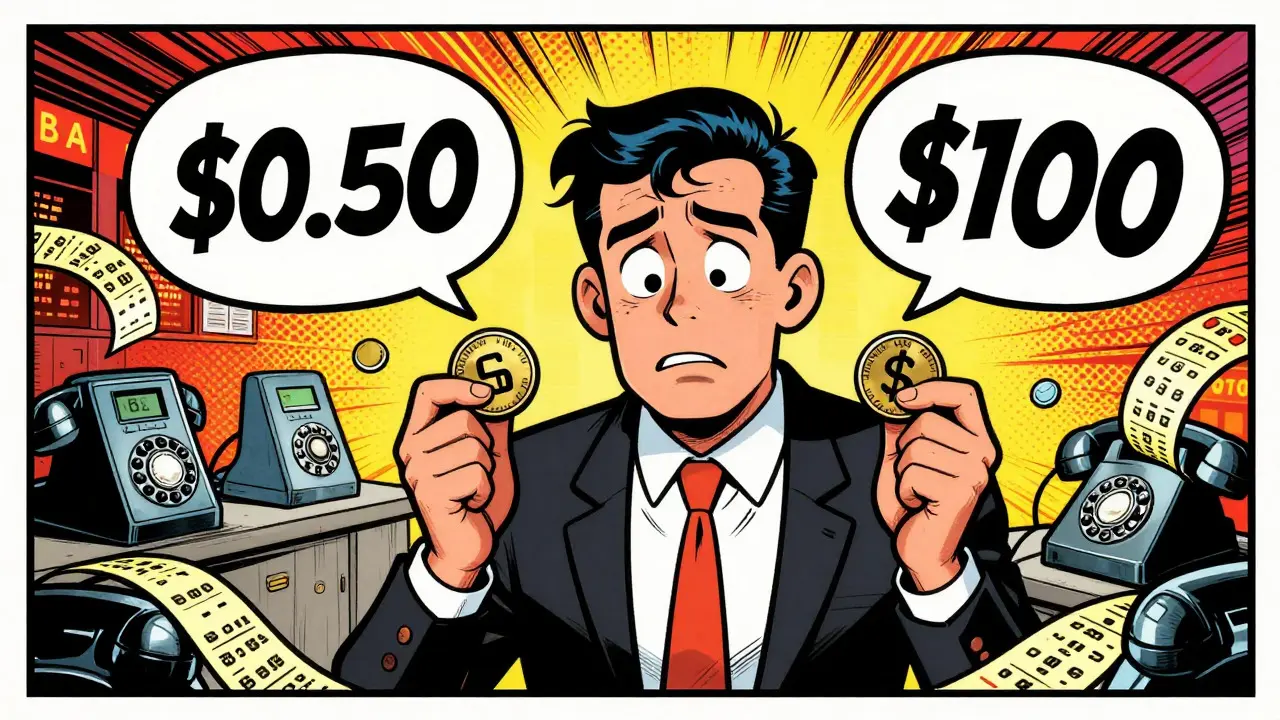
You see a coin trading at $0.50 and another at $100. Which one is bigger? Your gut might say the $100 coin, but in crypto, price alone is a trap. To understand the true size of a project, you need to look at its market capitalization. This single number tells you whether you are looking at a stable giant like Bitcoin or a risky micro-cap experiment.
Calculating this isn't rocket science, but getting it right requires understanding which supply number to use. Are we counting only the coins in your wallet? Or do we include the millions locked away by developers? Let's break down the math, the methods, and why this metric matters more than the ticker price.
The Basic Math: Price Times Supply
At its core, market cap is just multiplication. It measures the total value of all coins that are currently available for trade. The formula is simple:
Market Cap = Current Price × Circulating Supply
Let's plug in real numbers so this sticks. Imagine Bitcoin (BTC) is trading at $60,000. According to blockchain data, there are approximately 19.7 million BTC in circulation. You don't count the 21 million maximum limit yet; you only count what's out there.
- Price: $60,000
- Circulating Supply: 19,700,000 BTC
- Calculation: $60,000 × 19,700,000 = $1.182 Trillion
That $1.18 trillion figure is Bitcoin's circulating market cap. This is the number you see on CoinGecko or CoinMarketCap when you scroll through the top assets. It represents the current market value of the asset as it exists today.
Why does this matter? Because price can be misleading. A new token might cost $1,000 per coin, but if there are only 10 coins in existence, its market cap is just $10,000. That is a tiny, fragile project. Conversely, a token costing $0.01 with 1 billion coins has a $10 million market cap-much larger and likely more established.
Three Ways to Measure Size
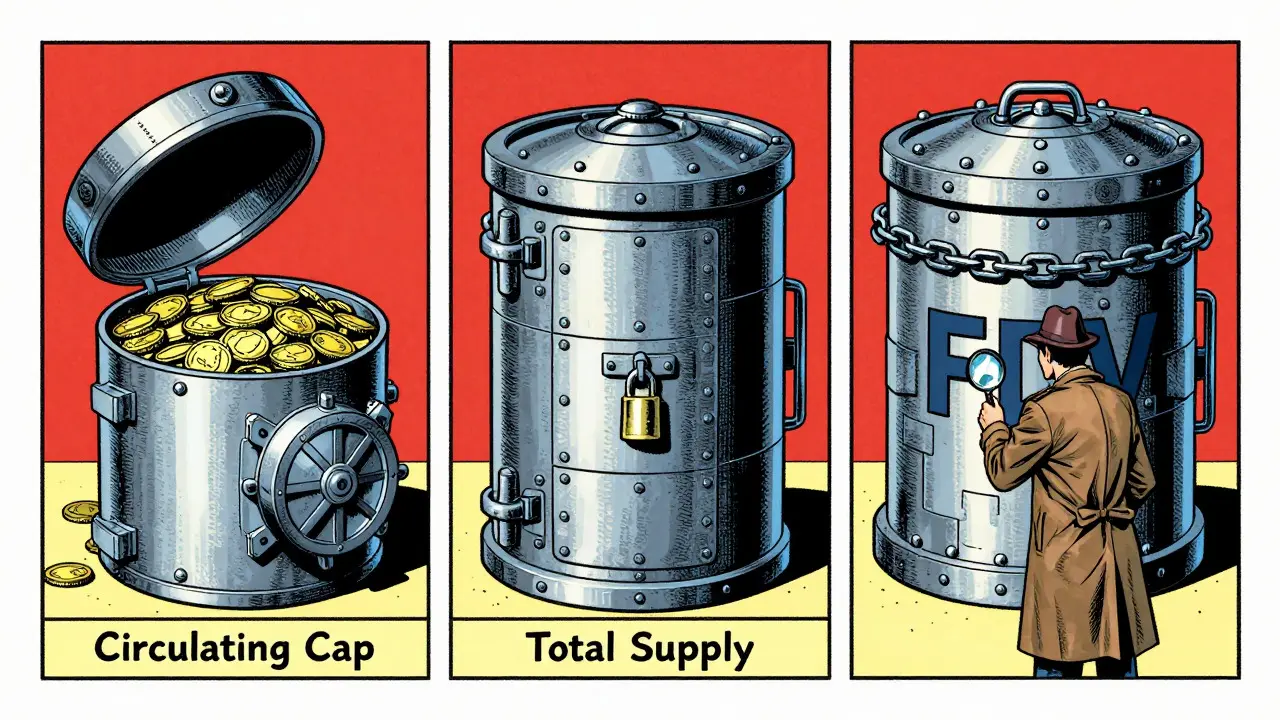
If you've looked at crypto data sites, you've probably noticed three different "cap" numbers for the same coin. This causes confusion for beginners. Here is the difference between them and when to use each.
| Metric | Formula | What It Includes | Best Used For |
|---|---|---|---|
| Circulating Market Cap | Price × Circulating Supply | Coins publicly traded and available. | Daily trading decisions and current valuation. |
| Total Market Cap | Price × Total Supply | All existing coins, including those locked or reserved. | Understanding immediate future dilution. |
| Fully Diluted Valuation (FDV) | Price × Max Supply | All coins that will ever exist, even those not minted yet. | Long-term investment risk and inflation analysis. |
Circulating Market Cap is the standard. It reflects the money actually in play. When analysts talk about "Bitcoin's market cap," they mean this number.
Total Market Cap adds in coins that exist but aren't tradable yet-perhaps held by a foundation or staked in a contract. This gives a slightly higher view of value but is less common in daily charts.
Fully Diluted Valuation (FDV) is crucial for new projects. Imagine a token with a max supply of 1 billion, but only 10 million are released. If the price is $1, the circulating cap is $10 million. But the FDV is $1 billion. That means 99% of the supply is waiting to enter the market. If those tokens unlock soon, the price could drop significantly due to selling pressure. Always check the FDV for newer altcoins.
Why Market Cap Beats Price
New investors often ask, "Will this coin reach $1?" This is the wrong question. The right question is, "Can this project support a $100 billion market cap?"
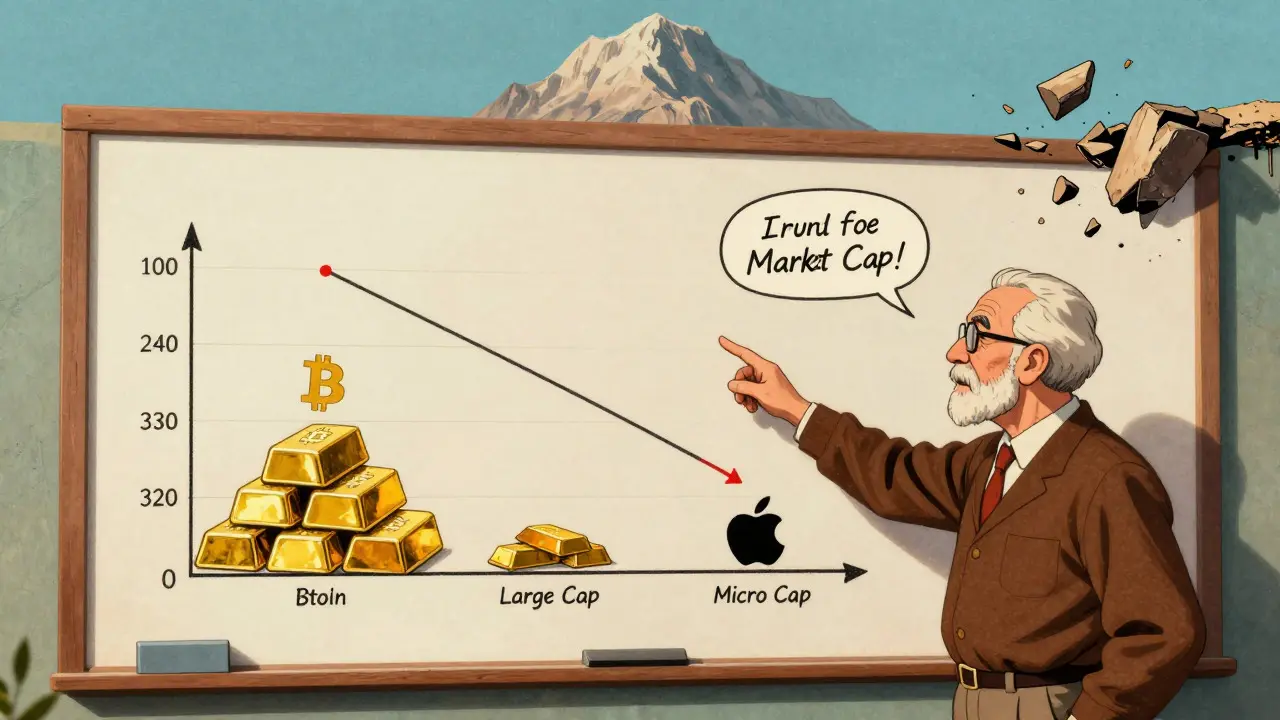
Consider Ethereum. In 2025, Ethereum's market cap hovered around $500 billion. If someone asked if ETH would hit $10,000, you'd need to do the math. With ~120 million ETH in circulation, a $10,000 price tag would imply a $1.2 trillion market cap. Is that realistic? Compare it to gold ($14 trillion) or Apple ($3 trillion). Suddenly, the target seems ambitious but possible. Without market cap, you're just guessing at prices.
Market cap also helps categorize risk. The industry generally groups coins into tiers based on their size:
- Large-Cap ($10B+): Bitcoin, Ethereum, Solana. Lower volatility, higher stability.
- Mid-Cap ($1B - $10B): Established projects with growth potential but higher risk.
- Small-Cap ($50M - $1B): High risk, high reward. Often unproven tech.
- Micro-Cap (Under $50M): Extreme risk. Prone to scams and liquidity issues.
If you see a "revolutionary" AI coin with a $2 million market cap, treat it with caution. It takes billions in buying power to move large caps, meaning they are harder to manipulate. Micro-caps can be pumped or dumped by a single whale with a few million dollars.
Pitfalls and Manipulations
Market cap isn't perfect. It can be gamed. One common trick is "supply obfuscation." Some projects report a low circulating supply to keep their market cap ranking high, even though many tokens are actually available but just not listed on major trackers yet.
Another issue is liquidity. A coin might have a $100 million market cap, but if only $10,000 trades in a day, you can't sell without crashing the price. Always look at the Market Cap to Volume Ratio. A healthy ratio is usually below 100:1. If the market cap is $1 billion but volume is only $1 million, the asset is illiquid. Your paper gains might not be real cash.
Data discrepancies also happen. CoinMarketCap and CoinGecko sometimes show different circulating supplies because they use different rules for counting locked tokens. Always cross-reference. If you are doing serious research, check the blockchain explorer directly to verify the supply figures.
Step-by-Step Calculation Guide
Want to calculate it yourself? Here is how professional analysts approach it:
- Find the Current Price: Use a reliable aggregator like CoinGecko or TradingView to get the weighted average price across exchanges. Don't use a single exchange's price, as it can be manipulated.
- Identify Circulating Supply: Check the project's documentation or a trusted tracker. Look for notes on "locked" or "vested" tokens. Subtract these from the total issued if they aren't tradable.
- Multiply: Price × Circulating Supply = Circulating Market Cap.
- Calculate FDV: Find the Maximum Supply (if fixed). Multiply Price × Max Supply. This shows the theoretical ceiling.
- Compare: Look at the ratio of Circulating Cap to FDV. If Circulating Cap is 10% of FDV, expect significant inflation as more tokens release.
For example, let's analyze a hypothetical DeFi token, "AlphaCoin."
- Price: $2.00
- Circulating Supply: 10 million
- Max Supply: 100 million
Circulating Cap = $2 × 10,000,000 = $20 million. FDV = $2 × 100,000,000 = $200 million.
The FDV is 10x the current cap. This suggests that unless demand grows massively, the price will likely drop as the remaining 90 million tokens enter the market over time.
Advanced Context: Beyond the Number
In 2025, institutional investors don't just look at raw market cap. They use adjusted metrics. The Global Blockchain Council introduced standards requiring platforms to disclose how they calculate supply. This reduces manipulation.
Analysts also pair market cap with on-chain metrics. For instance, the Network Value to Transactions (NVT) ratio compares market cap to transaction volume. A high NVT might indicate the network is overvalued relative to its actual usage. Think of it like the P/E ratio in stocks, but for blockchains.
Also, watch for token unlocks. Major releases of locked tokens can cause temporary dips. Tools like TokenUnlocks.app help you track these dates. If a large portion of supply is unlocking next month, the market cap might stay flat or drop despite good news, simply due to increased supply.
Is market cap the same as price?
No. Price is the cost of one unit. Market cap is the total value of all units in circulation. A cheap coin can have a huge market cap if there are billions of them, while an expensive coin can have a small market cap if there are very few.
What is Fully Diluted Valuation (FDV)?
FDV is the market cap if all possible coins were in circulation today. It is calculated by multiplying the current price by the maximum supply. It helps investors understand future inflation risks.
Why do different sites show different market caps?
Sites like CoinMarketCap and CoinGecko may use different definitions for "circulating supply." Some include staked tokens, others don't. Always check their methodology page for details.
Does a high market cap mean a safe investment?
Not necessarily, but it indicates stability. Large-cap coins are less volatile and harder to manipulate. However, they may have lower growth potential compared to smaller, riskier projects.
How often does market cap change?
It changes constantly, every second, as the price fluctuates. Circulating supply changes more slowly, usually when new coins are mined or unlocked from vesting schedules.





There are 19 Comments
Lisa Chong
Heather Austin
Ran Tao
Hamza k
Kim Kay
Brad Semp
Korn Arrieta
Jackie D
Ruth Williams
Sophie Nakasako
Kristy Morrow
John Harman
Antony Lopez
Kat Barr
Logan Edmison
Michelle Walker
Shay Thomson
DJ Maleko
Erika Pozzetto
Write a comment
Your email address will not be published. Required fields are marked *